| Date | Signal | Status | Proof |
|---|---|---|---|
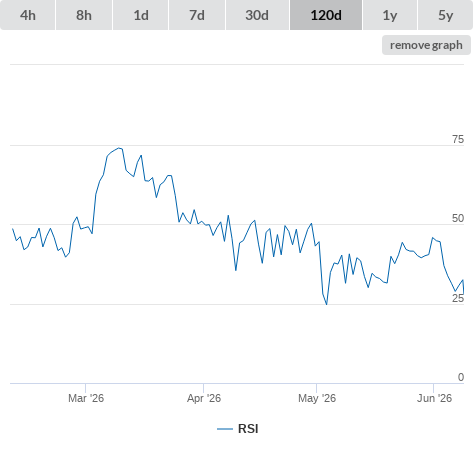
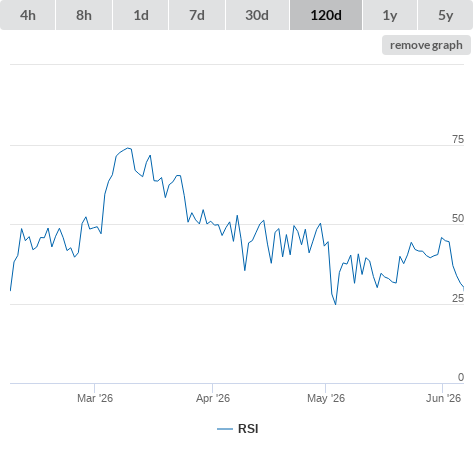
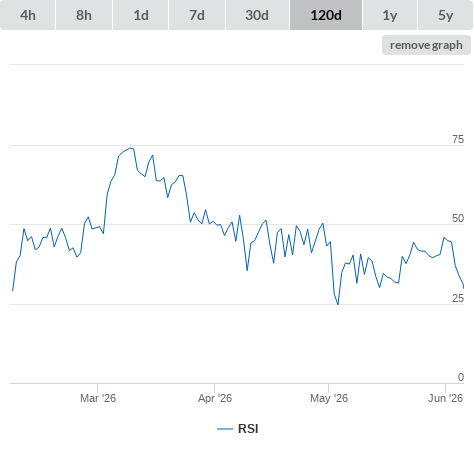
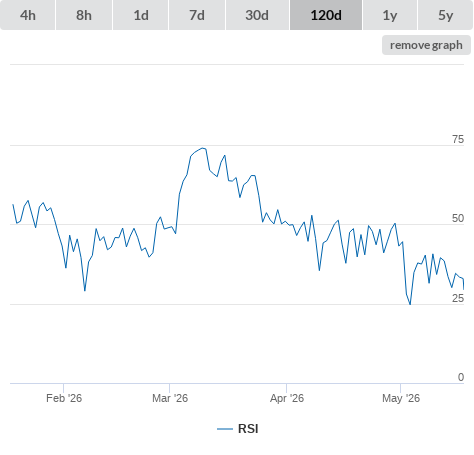
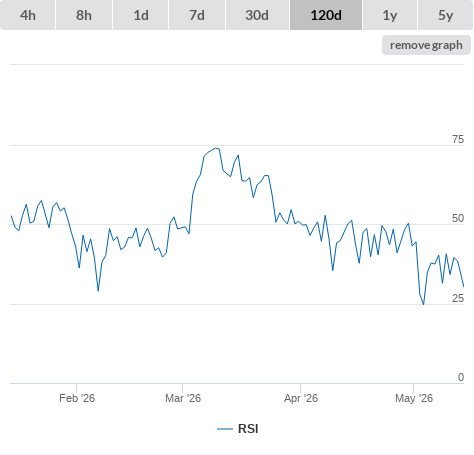
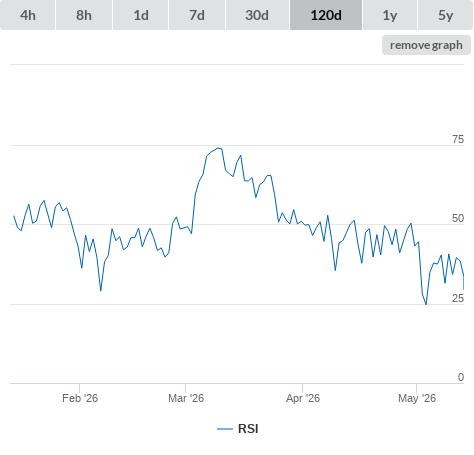
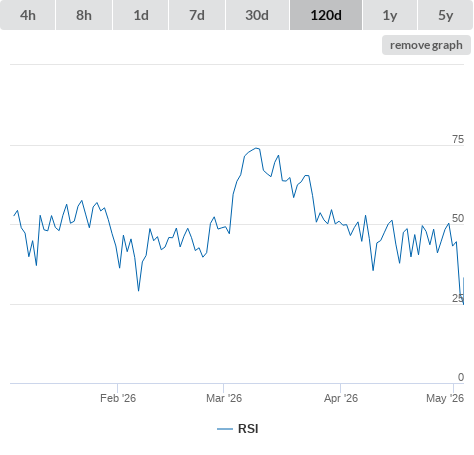
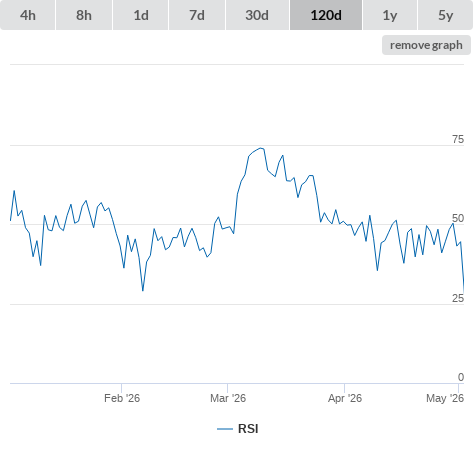
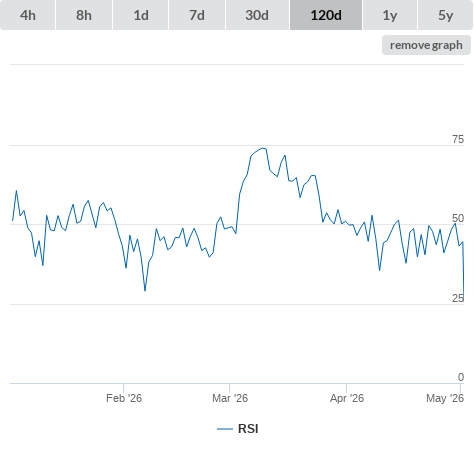
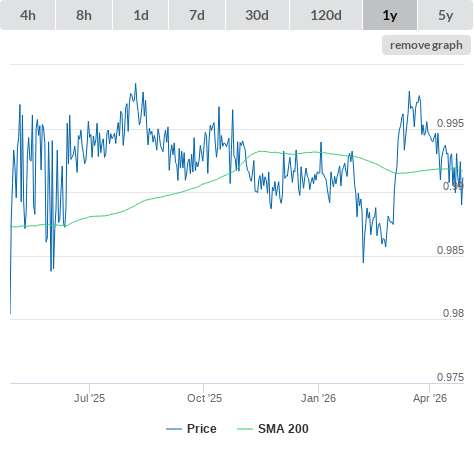
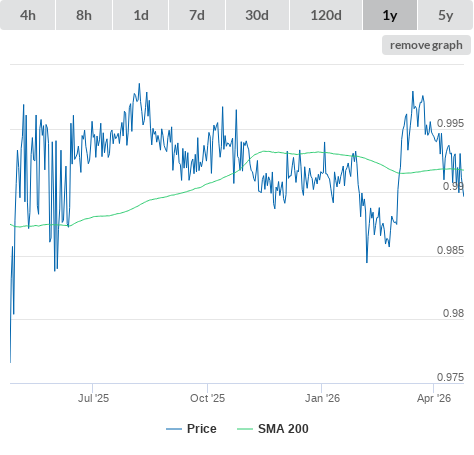
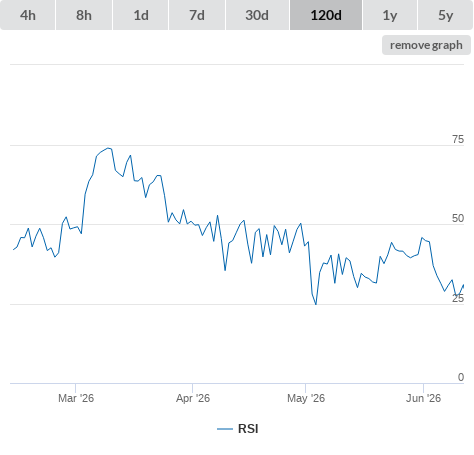
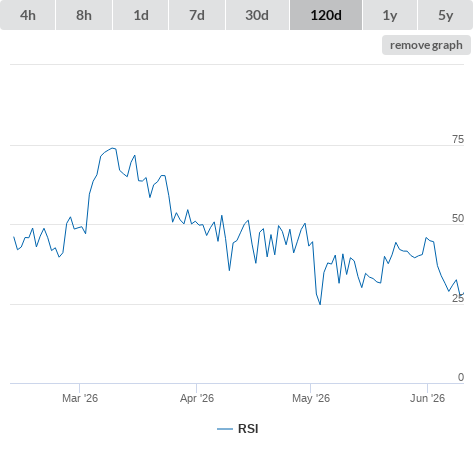
| 11-06-26 | RSI lower than 30 (true) | buy |
|
| 10-06-26 | RSI lower than 30 (true) | buy |
|
| 09-06-26 | RSI lower than 30 (false) | neutral |

|
| Information | ||
|---|---|---|
| Description | - | |
| Open source | false | |
| Type | token | |
| Links | ||
|---|---|---|
| Announcement | https://alchemixfi.medium.com | |
| Explorer | https://etherscan.io/token/0xBC6DA0FE9aD5f3b0d58160288917AA56653660E9 | |
| Source code | https://github.com/alchemix-finance | |
| Website | https://alchemix.fi | |
| Whitepaper | - | |
| General (click metric to see the graph on the left side) | |
|
|
|
|
|
|
|
|
|
|
|
|
|
|
|
|
|
|
|
|
|
|
|
|
|
|
|
| Github (click metric to see the graph on the left side) | |
|
|
|
|
|
|
|
|
|
|
|
|
|
|
|
|
|
|
|
|
|
|
|
|
| Reddit (click metric to see the graph on the left side) | |
|
|
|
|
|
|
|
|
|
|
|
|
| Search results (click metric to see the graph on the left side) | |
|
|
|
|
|
|
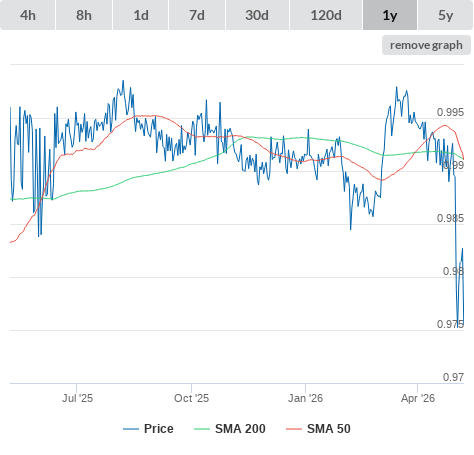
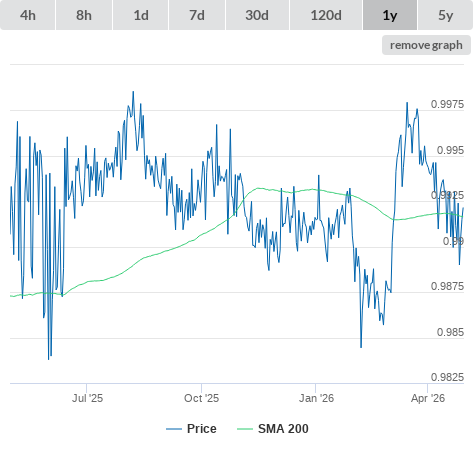
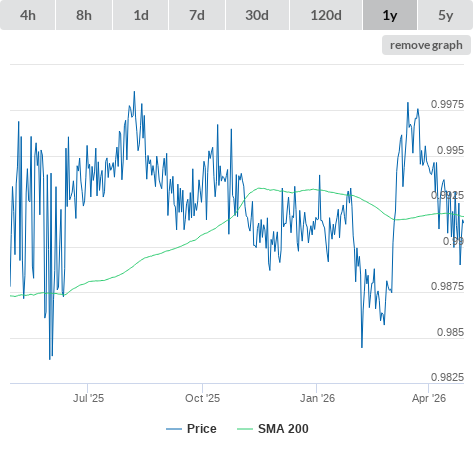
| Technical Indicators (moving averages) (click metric to see the graph on the left side) | |
|
|
|
|
|
|
|
|
|
|
|
|
|
|
|
|
|
|
|
|
|
|
|
|
|
|
|
| Technical Indicators (oscillators) (click metric to see the graph on the left side) | |
|
|
|
|
|
|
|
|
|
|
|
|
|
|
|
|
|
|
|
|
|
|
|
|
| Twitter (click metric to see the graph on the left side) | |
|
|
|
|
|
|