| Date | Signal | Status | Proof |
|---|---|---|---|
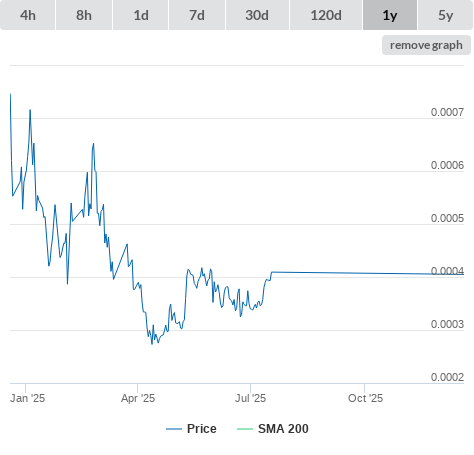
| 19-12-25 | Price higher than SMA200. (true) | buy |
|
| 19-12-25 | SMA20 higher than SMA50. (true) | buy |
|
| Information | ||
|---|---|---|
| Description | - | |
| Open source | false | |
| Type | token | |
| Links | ||
|---|---|---|
| Chat | https://t.me/perlinnetworkchat | |
| Explorer | https://etherscan.io/token/0xb5a73f5fc8bbdbce59bfd01ca8d35062e0dad801 | |
| https://facebook.com/perlin.network | ||
| Message board | https://medium.com/perlin-network | |
| https://www.reddit.com/r/perlin | ||
| Source code | https://github.com/perlin-network | |
| https://twitter.com/PERL_eco | ||
| Website | https://perlinx.finance | |
| Whitepaper | - | |
| General (click metric to see the graph on the left side) | |
|
|
|
|
|
|
|
|
|
|
|
|
|
|
|
|
|
|
|
|
|
|
|
|
|
|
|
| Github (click metric to see the graph on the left side) | |
|
|
|
|
|
|
|
|
|
|
|
|
|
|
|
|
|
|
|
|
|
|
|
|
| Reddit (click metric to see the graph on the left side) | |
|
|
|
|
|
|
|
|
|
|
|
|
| Search results (click metric to see the graph on the left side) | |
|
|
|
|
|
|
| Technical Indicators (moving averages) (click metric to see the graph on the left side) | |
|
|
|
|
|
|
|
|
|
|
|
|
|
|
|
|
|
|
|
|
|
|
|
|
|
|
|
| Technical Indicators (oscillators) (click metric to see the graph on the left side) | |
|
|
|
|
|
|
|
|
|
|
|
|
|
|
|
|
|
|
|
|
|
|
|
|
| Twitter (click metric to see the graph on the left side) | |
|
|
|
|
|
|