| Date | Signal | Status | Proof |
|---|---|---|---|
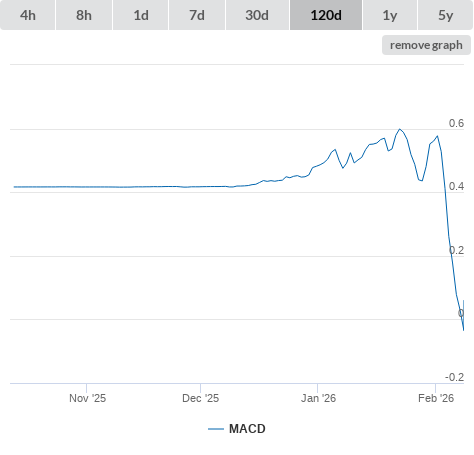
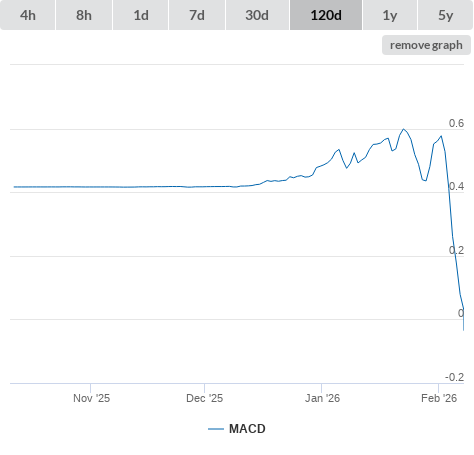
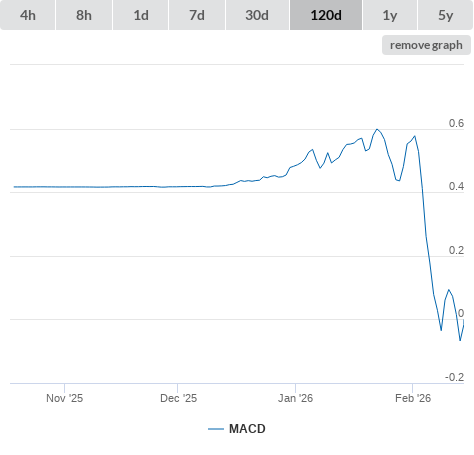
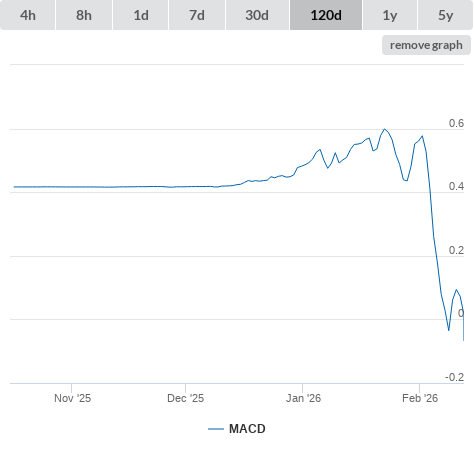
| 14-02-26 | MACD higher than 0 (true) | buy |
|
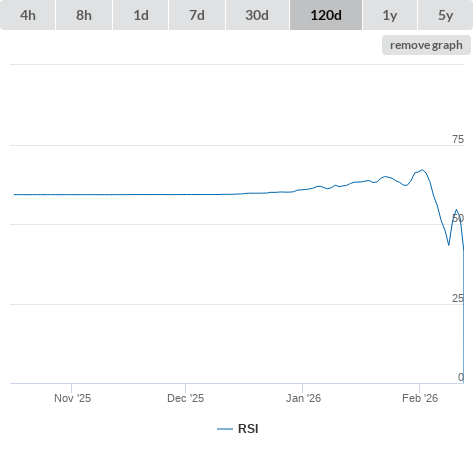
| 12-02-26 | RSI lower than 30 (true) | buy |
|
| 12-02-26 | MACD higher than 0 (false) | sell |
|
| Information | ||
|---|---|---|
| Open source | false | |
| Type | coin | |
| Links | ||
|---|---|---|
| Explorer | https://etherscan.io/token/0xe66747a101bff2dba3697199dcce5b743b454759 | |
| Message board | https://medium.com/@gatechain | |
| Source code | https://github.com/gatechain | |
| https://twitter.com/gatechain_io | ||
| Website | https://gatechain.io | |
| Whitepaper | - | |
| General (click metric to see the graph on the left side) | |
|
|
|
|
|
|
|
|
|
|
|
|
|
|
|
|
|
|
|
|
|
|
|
|
|
|
|
| Github (click metric to see the graph on the left side) | |
|
|
|
|
|
|
|
|
|
|
|
|
|
|
|
|
|
|
|
|
|
|
|
|
| Reddit (click metric to see the graph on the left side) | |
|
|
|
|
|
|
|
|
|
|
|
|
| Search results (click metric to see the graph on the left side) | |
|
|
|
|
|
|
| Technical Indicators (moving averages) (click metric to see the graph on the left side) | |
|
|
|
|
|
|
|
|
|
|
|
|
|
|
|
|
|
|
|
|
|
|
|
|
|
|
|
| Technical Indicators (oscillators) (click metric to see the graph on the left side) | |
|
|
|
|
|
|
|
|
|
|
|
|
|
|
|
|
|
|
|
|
|
|
|
|
| Twitter (click metric to see the graph on the left side) | |
|
|
|
|
|
|