The Coin Detective
Coins:
1997
Market cap:
$ 3354.29B
Volume 24h:
$ 112.93B
BTC dominance:
61.8%

General

$ 0.0016
Price
$ 10.23M
Volume 24h
$ 74.05M
Market cap
13.91%
Vol / Mcap
18.15B
Supply

Technicals

$ 0.0050
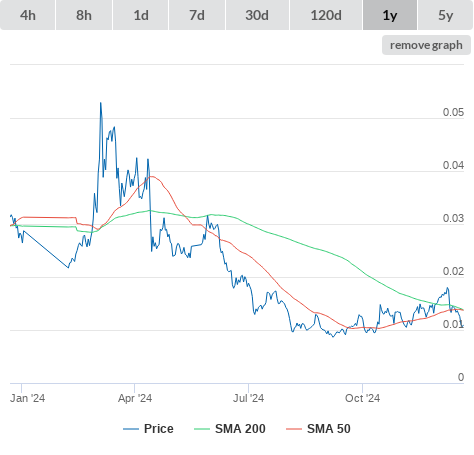
SMA 50
$ 0.0101
SMA 200
27
RSI
-30
ROC
-0
MACD
 
News
18-06-2025 22:08 18-06 22:08 cointelegraph.com Here’s what happened in crypto today
17-06-2025 13:33 17-06 13:33 cointelegraph.com Here’s what happened in crypto today
07-06-2025 13:12 07-06 13:12 cointelegraph.com Here’s what happened in crypto today
06-06-2025 13:57 06-06 13:57 cointelegraph.com Here’s what happened in crypto today
01-06-2025 13:16 01-06 13:16 cointelegraph.com Here’s what happened in crypto today
15-05-2025 21:58 15-05 21:58 cointelegraph.com Here’s what happened in crypto today
09-04-2025 21:48 09-04 21:48 cointelegraph.com Here’s what happened in crypto today
30-03-2025 21:54 30-03 21:54 cointelegraph.com Here’s what happened in crypto today
26-03-2025 21:55 26-03 21:55 cointelegraph.com Here’s what happened in crypto today
18-03-2025 19:28 18-03 19:28 cointelegraph.com Here’s what happened in crypto today
12-03-2025 21:53 12-03 21:53 cointelegraph.com Here’s what happened in crypto today
12-03-2025 13:15 12-03 13:15 cointelegraph.com Here’s what happened in crypto today
11-03-2025 21:44 11-03 21:44 cointelegraph.com Here’s what happened in crypto today
11-03-2025 13:44 11-03 13:44 cointelegraph.com Here’s what happened in crypto today
10-03-2025 21:39 10-03 21:39 cointelegraph.com Here’s what happened in crypto today
10-03-2025 12:48 10-03 12:48 cointelegraph.com Here’s what happened in crypto today
09-03-2025 20:55 09-03 20:55 cointelegraph.com Here’s what happened in crypto today
08-03-2025 21:53 08-03 21:53 cointelegraph.com Here’s what happened in crypto today
Information
Links
General (click metric to see the graph on the left side)
18.15B
$ 74.05M
445
69B
$ 0.0016
₿ 0.0000
69B
13.91%
$ 10.23M
Github (click metric to see the graph on the left side)
0
0
0
0
0
0
0
0
Reddit (click metric to see the graph on the left side)
0
0
0
0
Search results (click metric to see the graph on the left side)
0
0
Technical Indicators (moving averages) (click metric to see the graph on the left side)
$ 0.0031
$ 0.0036
$ 0.0090
$ 0.0052
0
$ 0.0032
$ 0.0036
$ 0.0101
$ 0.0050
Technical Indicators (oscillators) (click metric to see the graph on the left side)
0
-135
-0
-17
-30
27
0
-100
Twitter (click metric to see the graph on the left side)
0
0