| Date | Signal | Status | Proof |
|---|---|---|---|
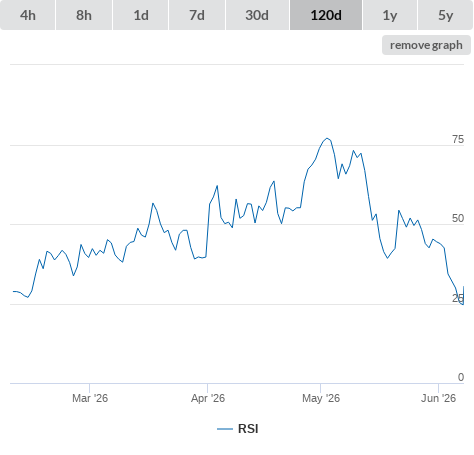
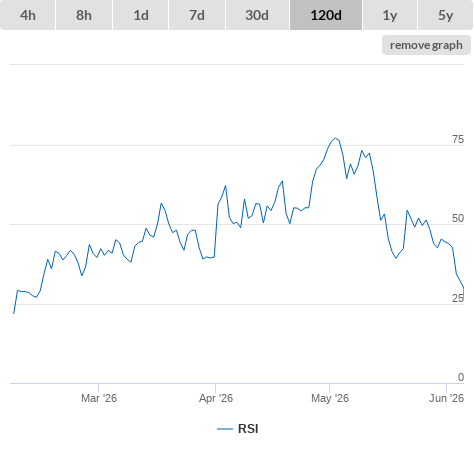
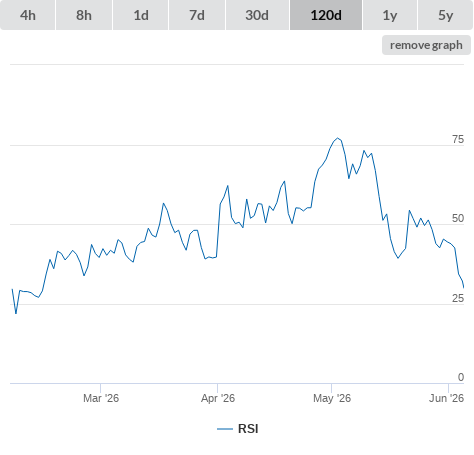
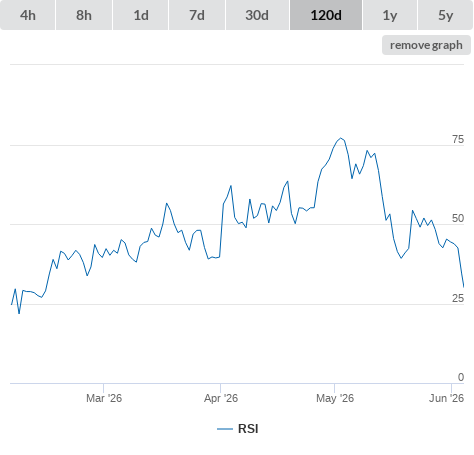
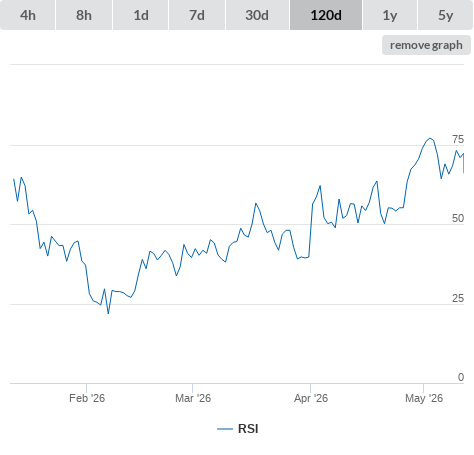
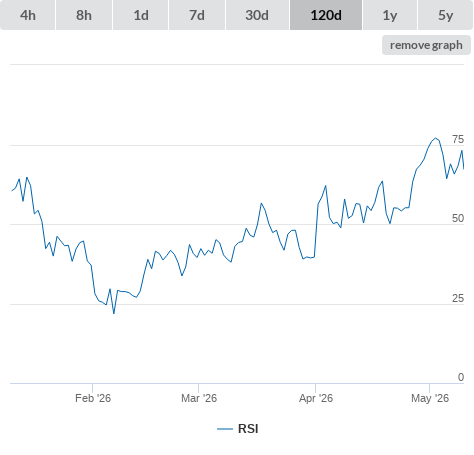
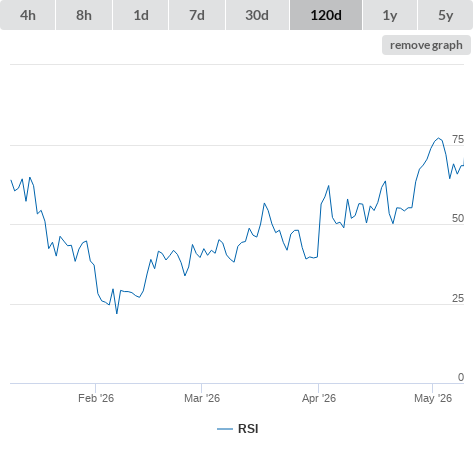
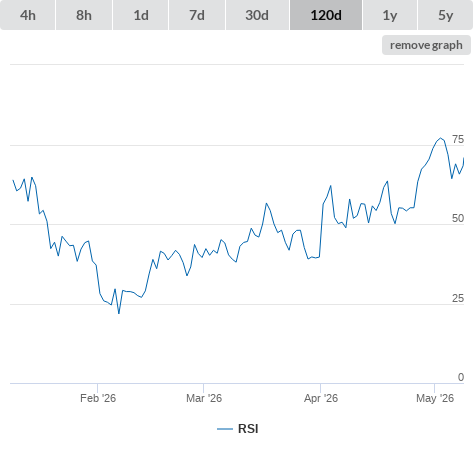
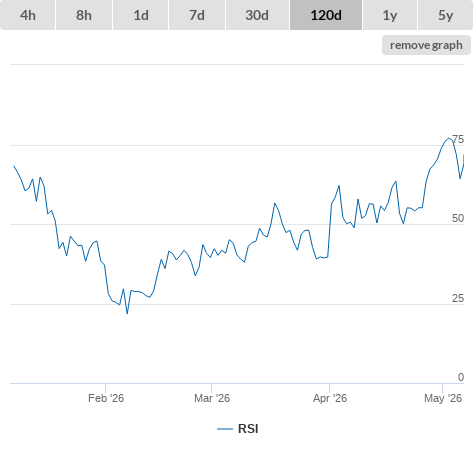
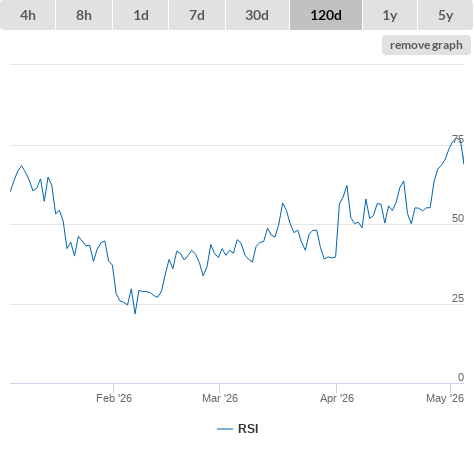
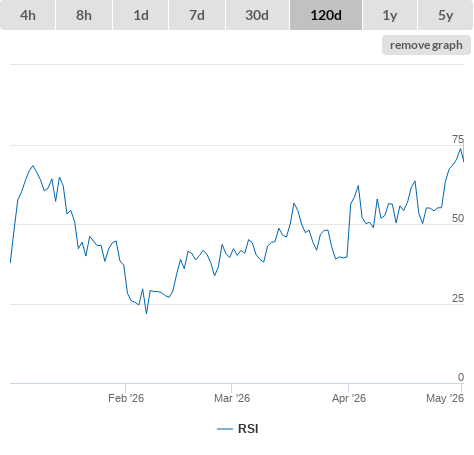
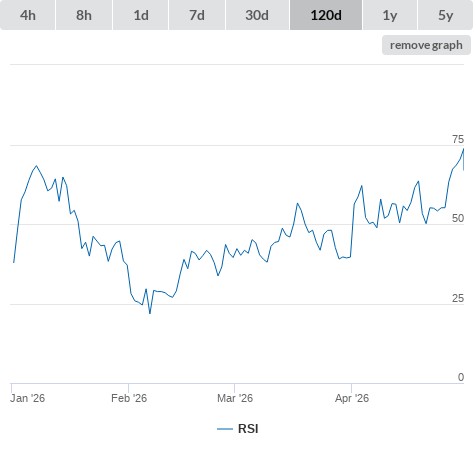
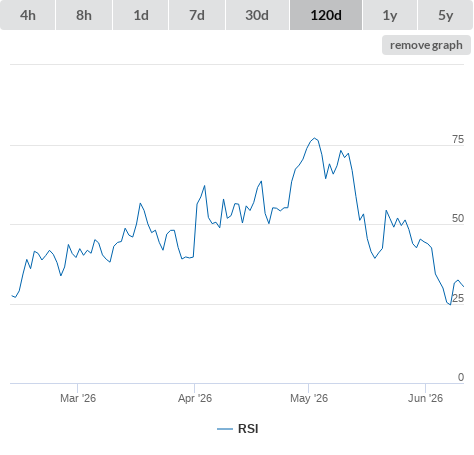
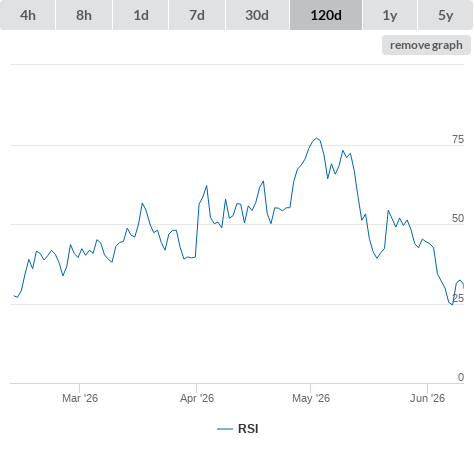
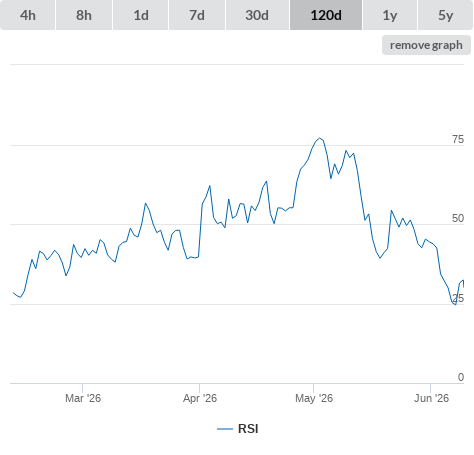
| 11-06-26 | RSI lower than 30 (false) | neutral |
|
| 10-06-26 | RSI lower than 30 (true) | buy |
|
| 09-06-26 | RSI lower than 30 (true) | buy |
|
| Information | ||
|---|---|---|
| Description | - | |
| Open source | false | |
| Type | token | |
| Links | ||
|---|---|---|
| Announcement | https://raydium.medium.com | |
| Explorer | https://explorer.solana.com/address/4k3Dyjzvzp8eMZWUXbBCjEvwSkkk59S5iCNLY3QrkX6R | |
| Website | https://raydium.io | |
| Whitepaper | - | |
| General (click metric to see the graph on the left side) | |
|
|
|
|
|
|
|
|
|
|
|
|
|
|
|
|
|
|
|
|
|
|
|
|
|
|
|
| Github (click metric to see the graph on the left side) | |
|
|
|
|
|
|
|
|
|
|
|
|
|
|
|
|
|
|
|
|
|
|
|
|
| Reddit (click metric to see the graph on the left side) | |
|
|
|
|
|
|
|
|
|
|
|
|
| Search results (click metric to see the graph on the left side) | |
|
|
|
|
|
|
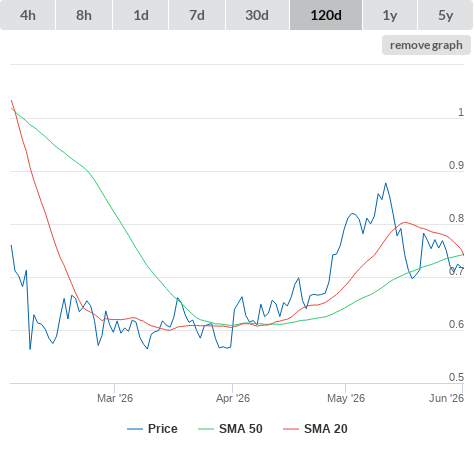
| Technical Indicators (moving averages) (click metric to see the graph on the left side) | |
|
|
|
|
|
|
|
|
|
|
|
|
|
|
|
|
|
|
|
|
|
|
|
|
|
|
|
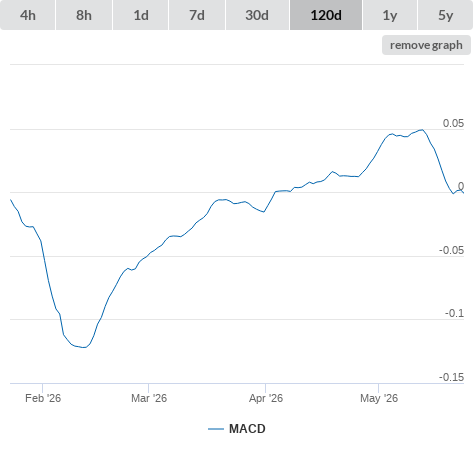
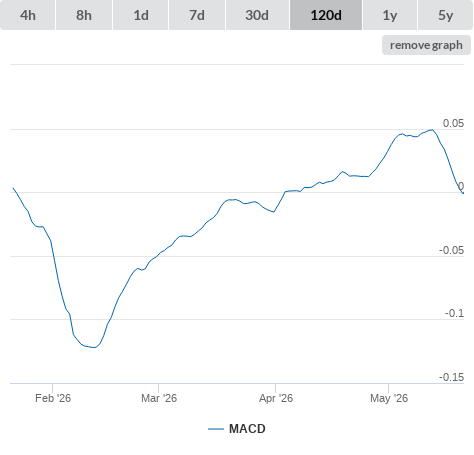
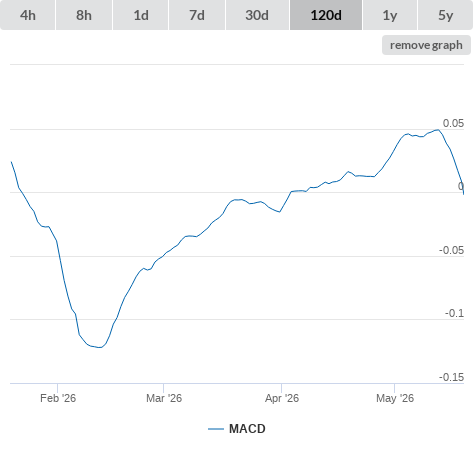
| Technical Indicators (oscillators) (click metric to see the graph on the left side) | |
|
|
|
|
|
|
|
|
|
|
|
|
|
|
|
|
|
|
|
|
|
|
|
|
| Twitter (click metric to see the graph on the left side) | |
|
|
|
|
|
|