| Date | Signal | Status | Proof |
|---|---|---|---|
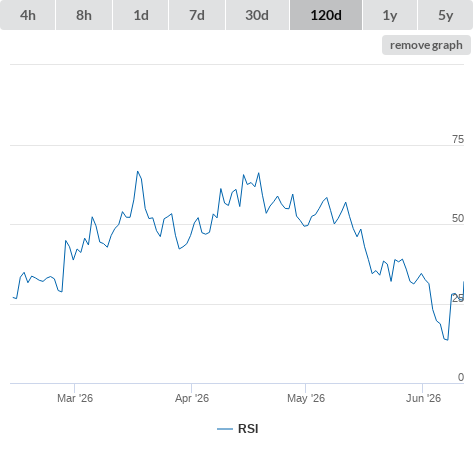
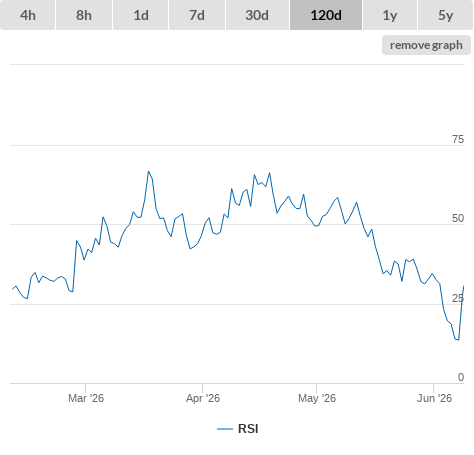
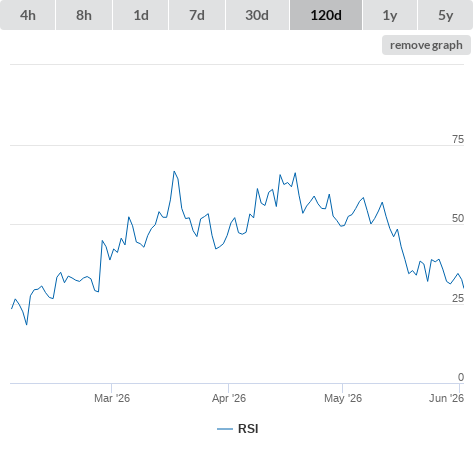
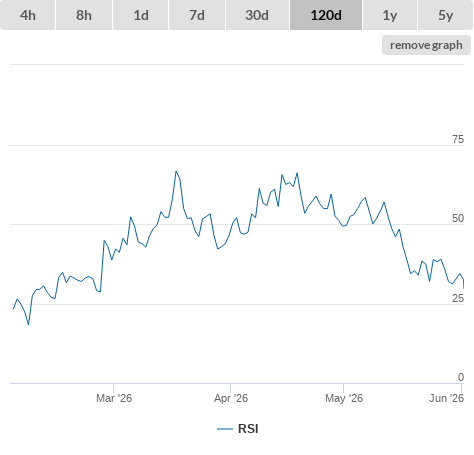
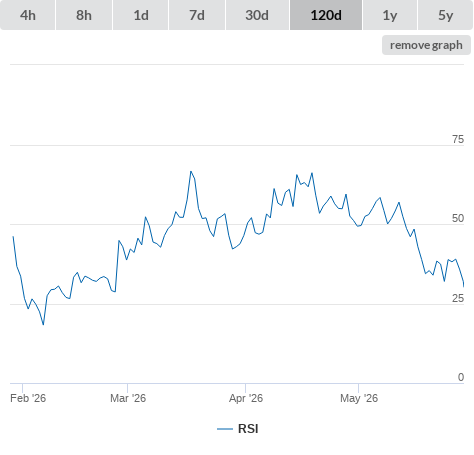
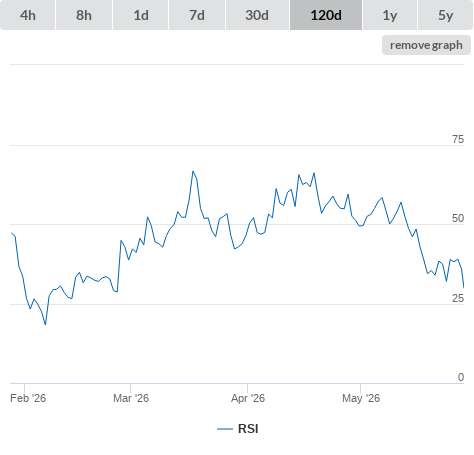
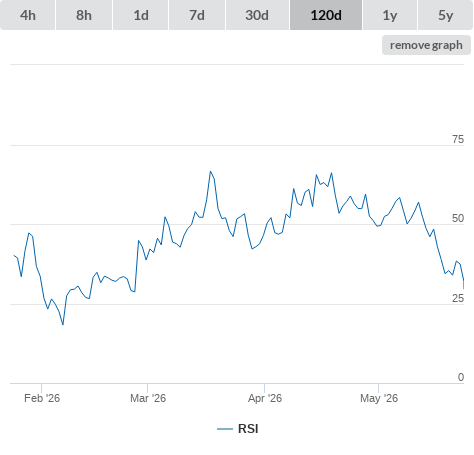
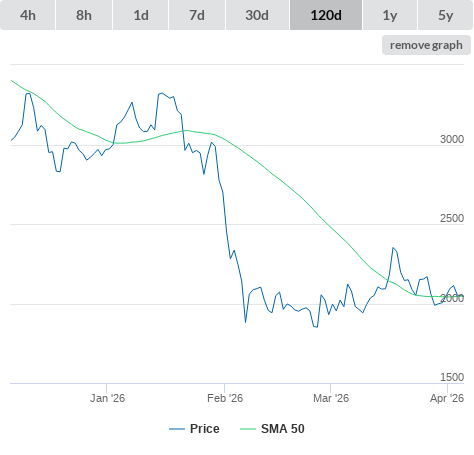
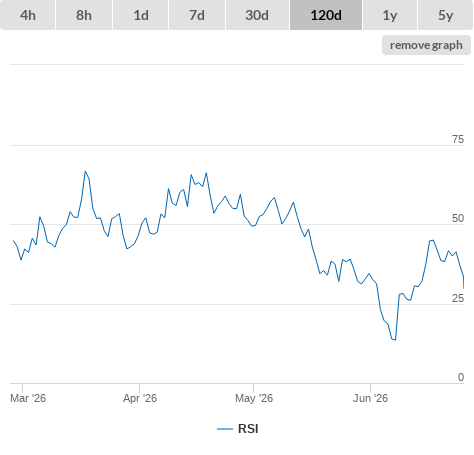
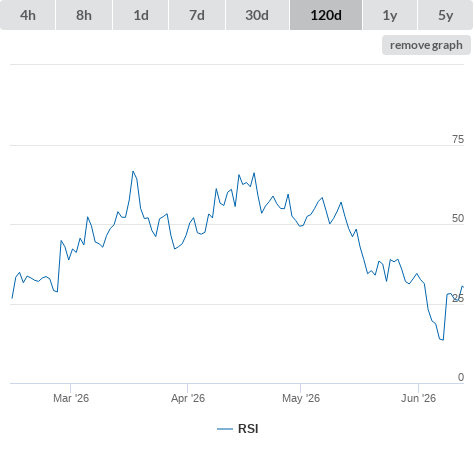
| 25-06-26 | RSI lower than 30 (true) | buy |
|
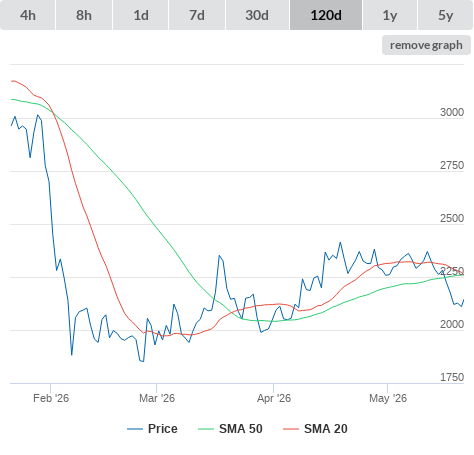
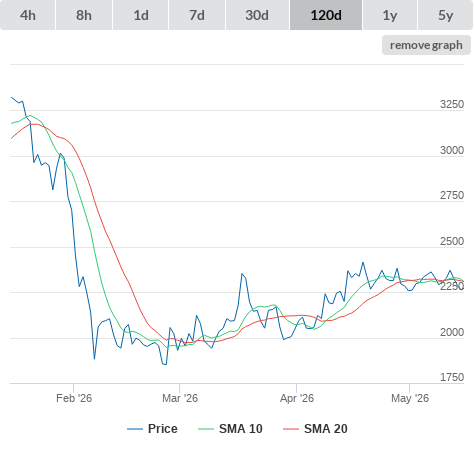
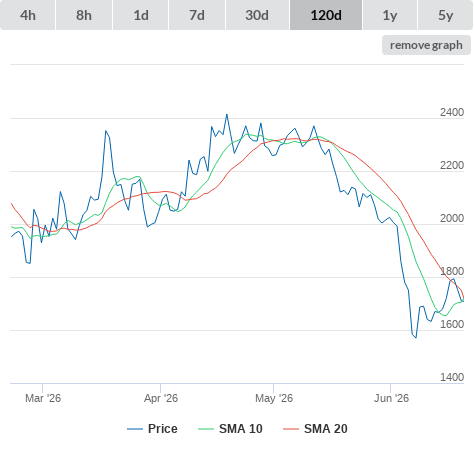
| 20-06-26 | SMA10 higher than SMA20. (true) | buy |
|
| 12-06-26 | RSI lower than 30 (true) | buy |
|
| Information | ||
|---|---|---|
| Description | - | |
| Open source | false | |
| Type | token | |
| Links | ||
|---|---|---|
| Announcement | https://blog.lido.fi | |
| Explorer | https://etherscan.io/token/0xae7ab96520de3a18e5e111b5eaab095312d7fe84 | |
| https://www.reddit.com/r/lidofinance | ||
| Source code | https://github.com/lidofinance | |
| Website | https://www.lido.fi | |
| Whitepaper | - | |
| General (click metric to see the graph on the left side) | |
|
|
|
|
|
|
|
|
|
|
|
|
|
|
|
|
|
|
|
|
|
|
|
|
|
|
|
| Github (click metric to see the graph on the left side) | |
|
|
|
|
|
|
|
|
|
|
|
|
|
|
|
|
|
|
|
|
|
|
|
|
| Reddit (click metric to see the graph on the left side) | |
|
|
|
|
|
|
|
|
|
|
|
|
| Search results (click metric to see the graph on the left side) | |
|
|
|
|
|
|
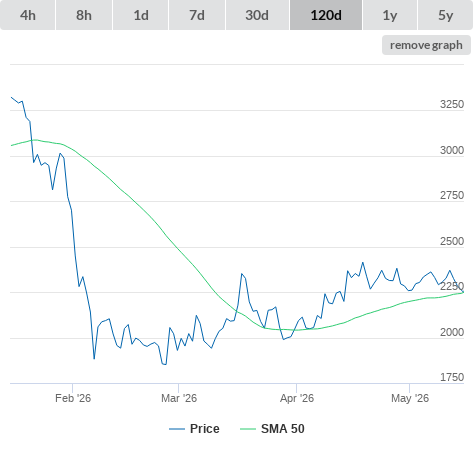
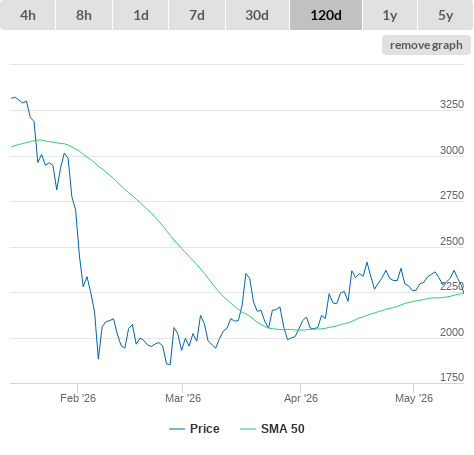
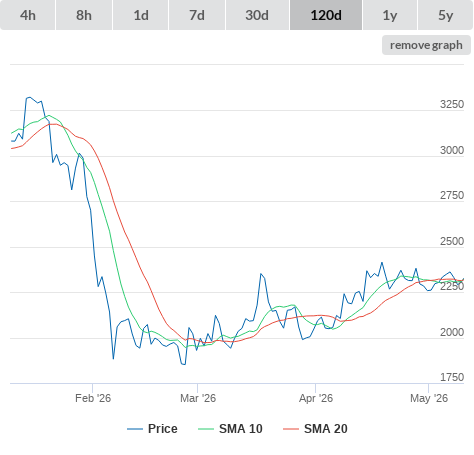
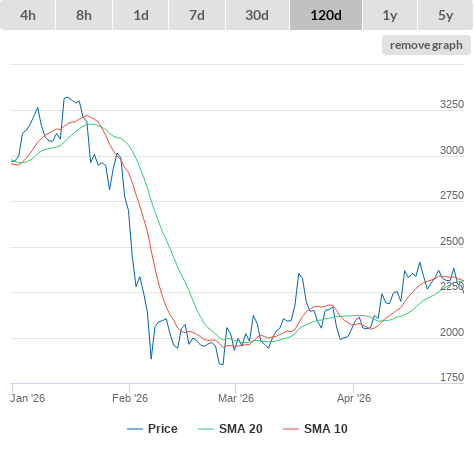
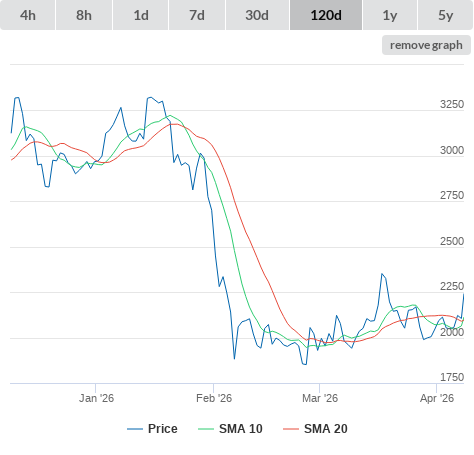
| Technical Indicators (moving averages) (click metric to see the graph on the left side) | |
|
|
|
|
|
|
|
|
|
|
|
|
|
|
|
|
|
|
|
|
|
|
|
|
|
|
|
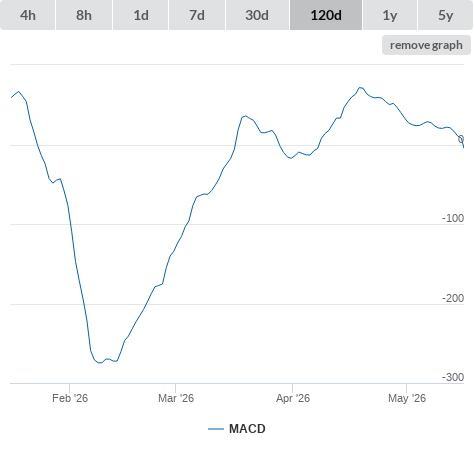
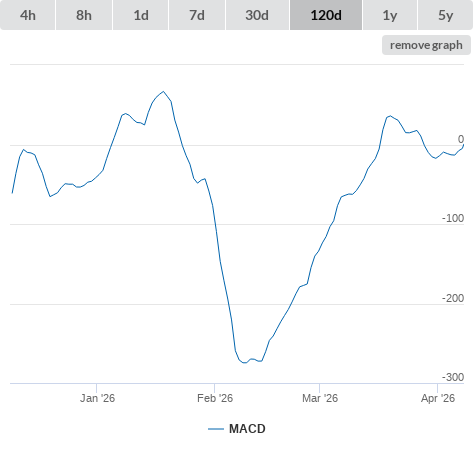
| Technical Indicators (oscillators) (click metric to see the graph on the left side) | |
|
|
|
|
|
|
|
|
|
|
|
|
|
|
|
|
|
|
|
|
|
|
|
|
| Twitter (click metric to see the graph on the left side) | |
|
|
|
|
|
|