| Date | Signal | Status | Proof |
|---|---|---|---|
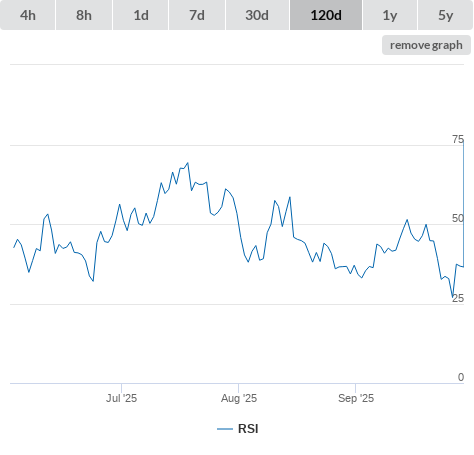
| 29-09-25 | RSI higher than 70 (true) | sell |
|
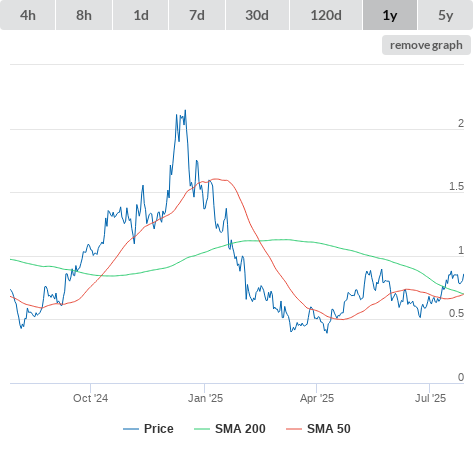
| 28-07-25 | SMA50 higher than SMA200. (true) | buy |
|
| 18-07-25 | RSI higher than 70 (false) | neutral |

|
| Information | ||
|---|---|---|
| Description | - | |
| Open source | false | |
| Type | token | |
| Links | ||
|---|---|---|
| Explorer | https://etherscan.io/token/0xe53EC727dbDEB9E2d5456c3be40cFF031AB40A55 | |
| Message board | https://medium.com/superfarm | |
| Website | https://superfarm.io | |
| Whitepaper | - | |
| General (click metric to see the graph on the left side) | |
|
|
|
|
|
|
|
|
|
|
|
|
|
|
|
|
|
|
|
|
|
|
|
|
|
|
|
| Github (click metric to see the graph on the left side) | |
|
|
|
|
|
|
|
|
|
|
|
|
|
|
|
|
|
|
|
|
|
|
|
|
| Reddit (click metric to see the graph on the left side) | |
|
|
|
|
|
|
|
|
|
|
|
|
| Search results (click metric to see the graph on the left side) | |
|
|
|
|
|
|
| Technical Indicators (moving averages) (click metric to see the graph on the left side) | |
|
|
|
|
|
|
|
|
|
|
|
|
|
|
|
|
|
|
|
|
|
|
|
|
|
|
|
| Technical Indicators (oscillators) (click metric to see the graph on the left side) | |
|
|
|
|
|
|
|
|
|
|
|
|
|
|
|
|
|
|
|
|
|
|
|
|
| Twitter (click metric to see the graph on the left side) | |
|
|
|
|
|
|


