| Date | Signal | Status | Proof |
|---|---|---|---|
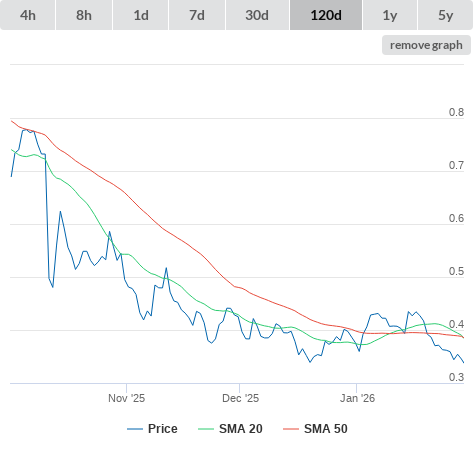
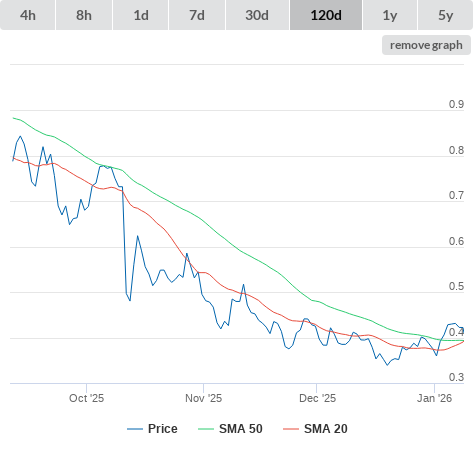
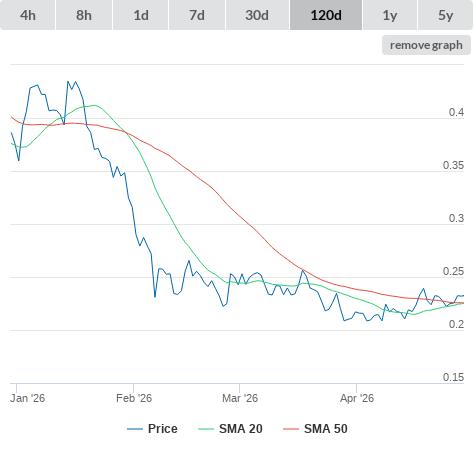
| 29-04-26 | SMA20 higher than SMA50. (true) | buy |
|
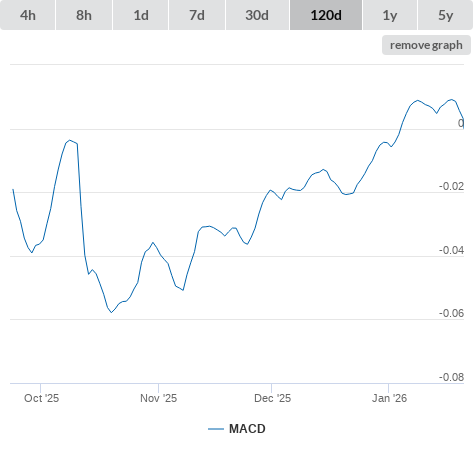
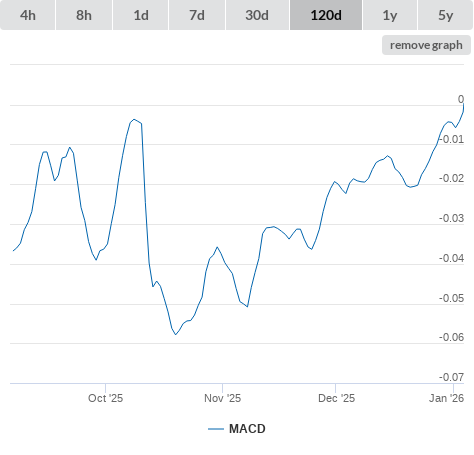
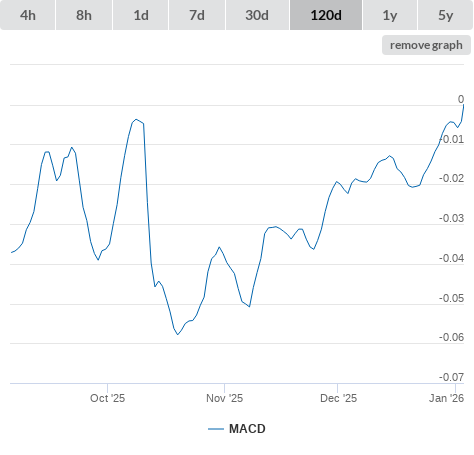
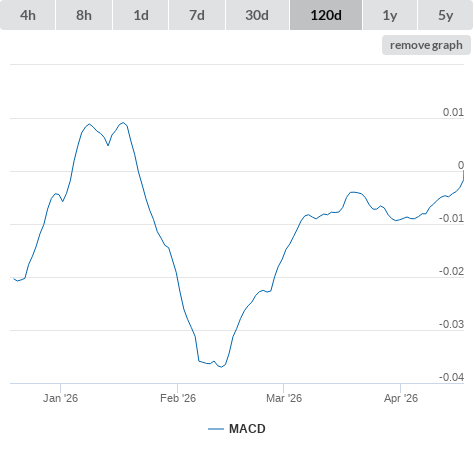
| 17-04-26 | MACD higher than 0 (true) | buy |
|
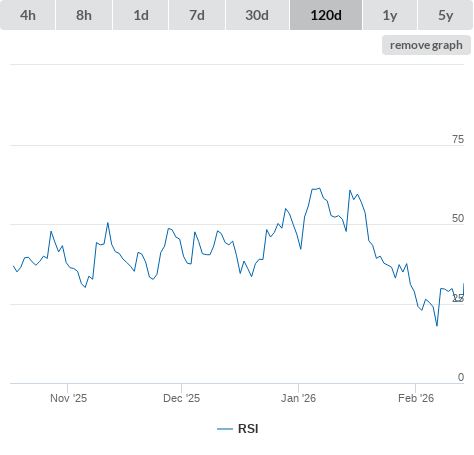
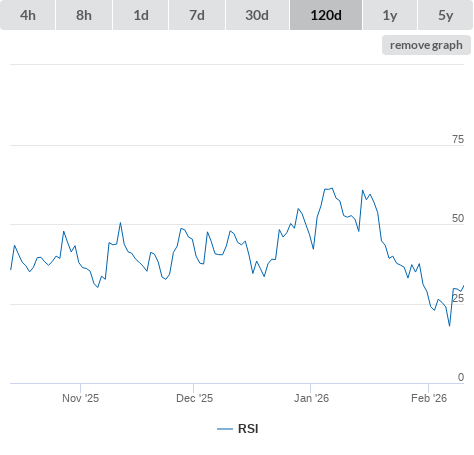
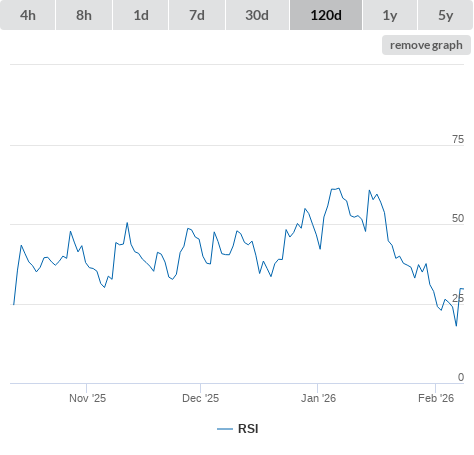
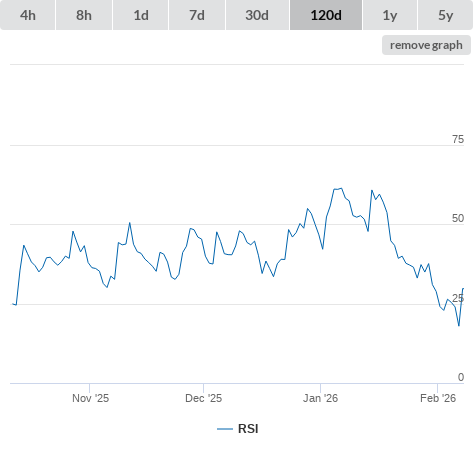
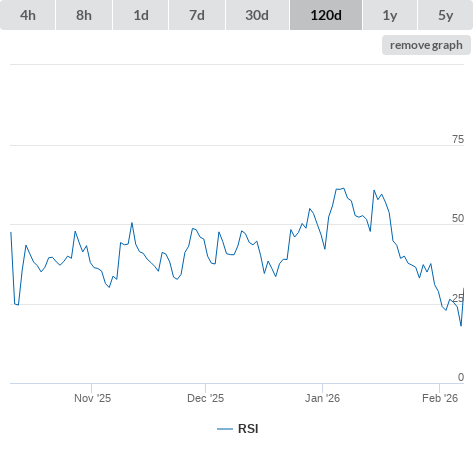
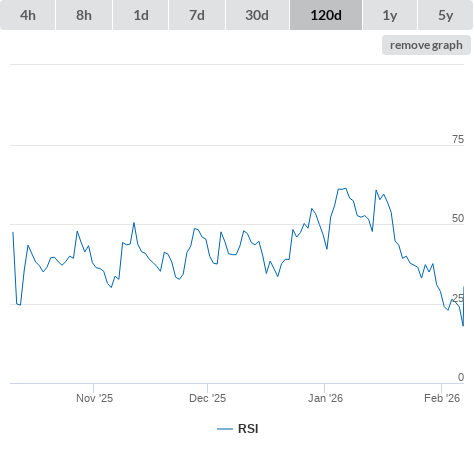
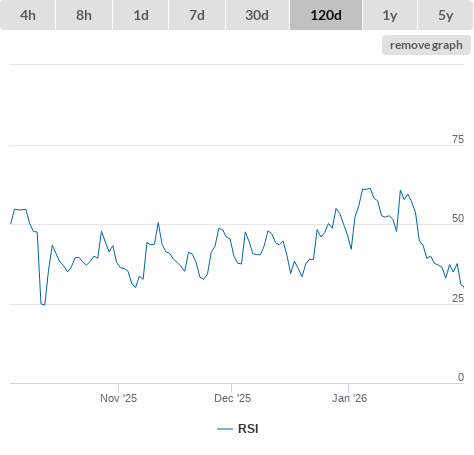
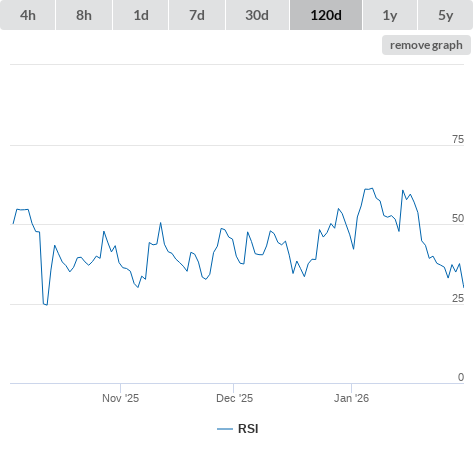
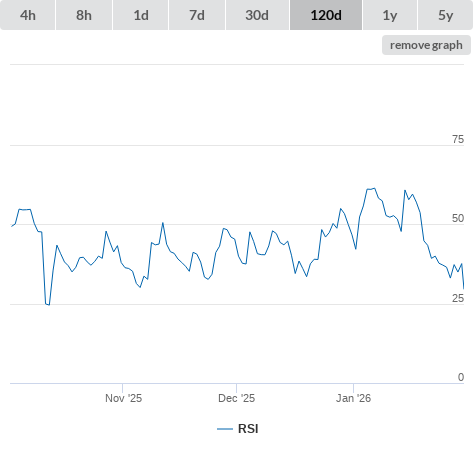
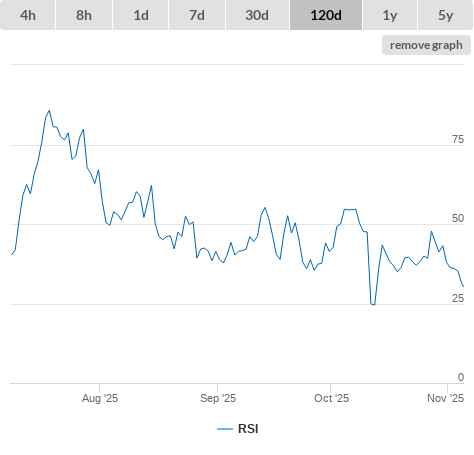
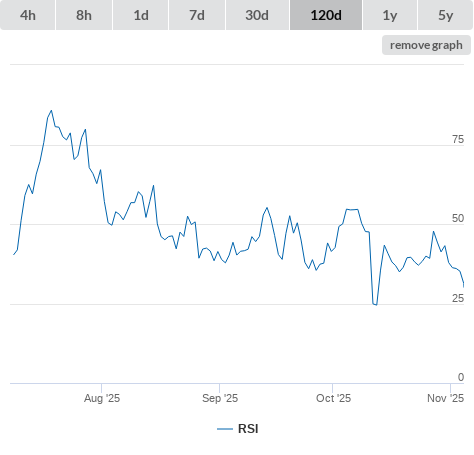
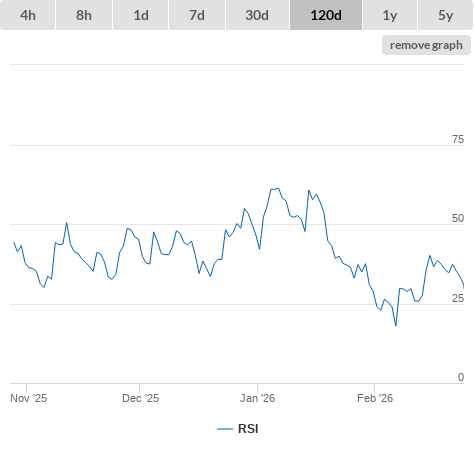
| 24-02-26 | RSI lower than 30 (true) | buy |
|
| Information | ||
|---|---|---|
| Description | - | |
| Hash algorithm | None | |
| Open source | true | |
| Proof type | Not mineable | |
| Type | token | |
| Links | ||
|---|---|---|
| Blog | https://guides.curve.fi | |
| Discord | https://discord.gg/9uEHakc | |
| Source code | https://github.com/curvefi | |
| Telegram | https://t.me/curvefi | |
| https://twitter.com/curvefinance | ||
| Website | https://www.curve.fi/ | |
| Whitepaper | - | |
| General (click metric to see the graph on the left side) | |
|
|
|
|
|
|
|
|
|
|
|
|
|
|
|
|
|
|
|
|
|
|
|
|
|
|
|
| Github (click metric to see the graph on the left side) | |
|
|
|
|
|
|
|
|
|
|
|
|
|
|
|
|
|
|
|
|
|
|
|
|
| Reddit (click metric to see the graph on the left side) | |
|
|
|
|
|
|
|
|
|
|
|
|
| Search results (click metric to see the graph on the left side) | |
|
|
|
|
|
|
| Technical Indicators (moving averages) (click metric to see the graph on the left side) | |
|
|
|
|
|
|
|
|
|
|
|
|
|
|
|
|
|
|
|
|
|
|
|
|
|
|
|
| Technical Indicators (oscillators) (click metric to see the graph on the left side) | |
|
|
|
|
|
|
|
|
|
|
|
|
|
|
|
|
|
|
|
|
|
|
|
|
| Twitter (click metric to see the graph on the left side) | |
|
|
|
|
|
|