| Date | Signal | Status | Proof |
|---|---|---|---|
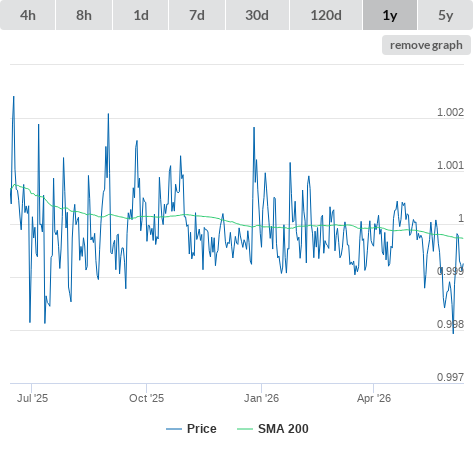
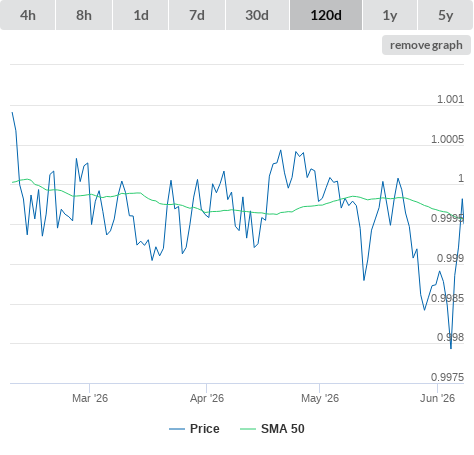
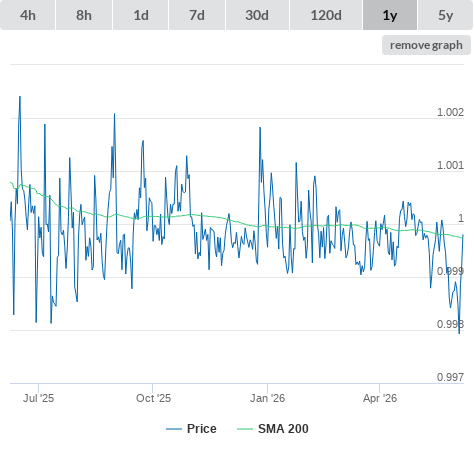
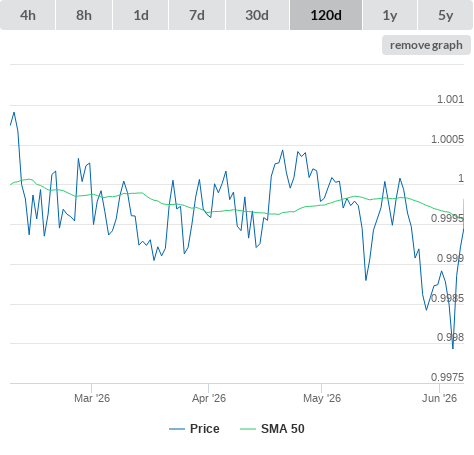
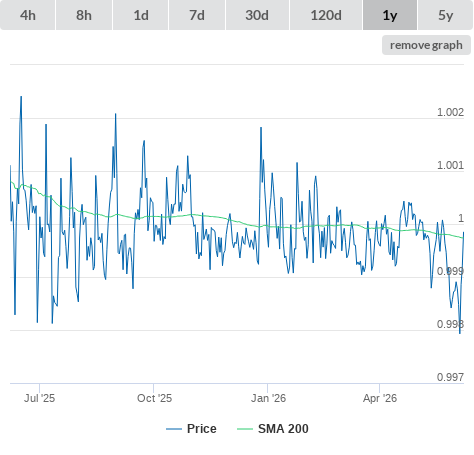
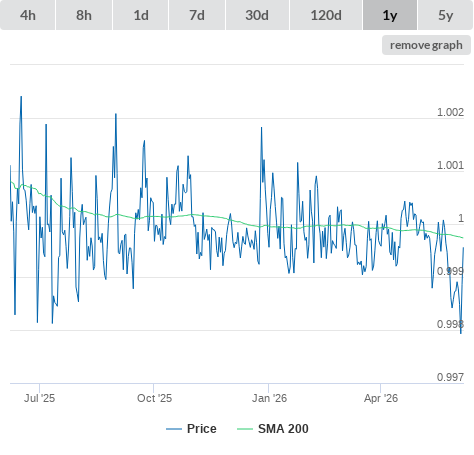
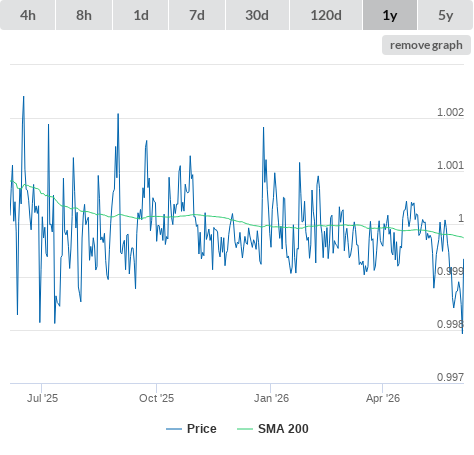
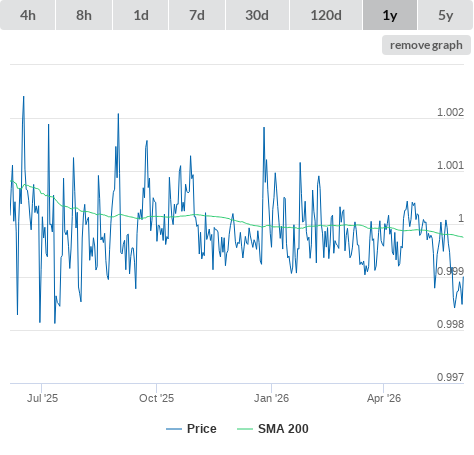
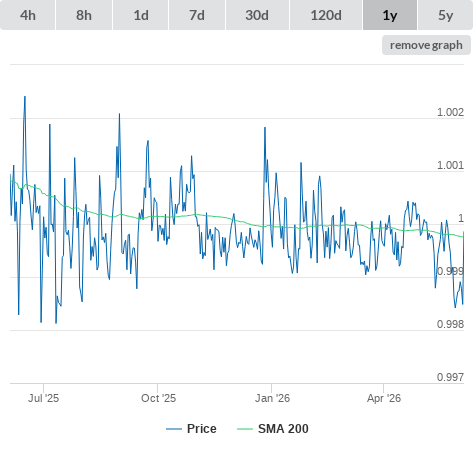
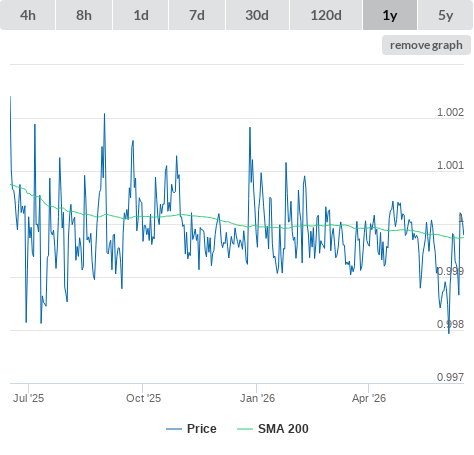
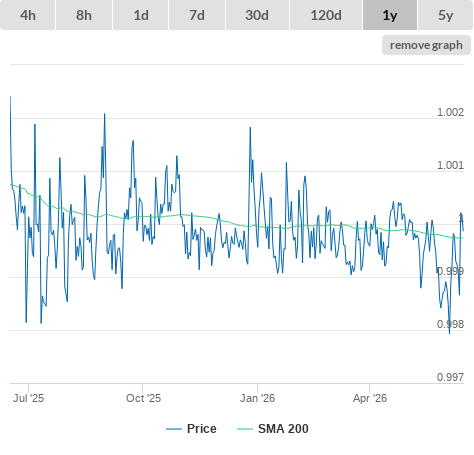
| 16-06-26 | Price higher than SMA200. (true) | buy |
|
| 15-06-26 | Price higher than SMA200. (false) | sell |
|
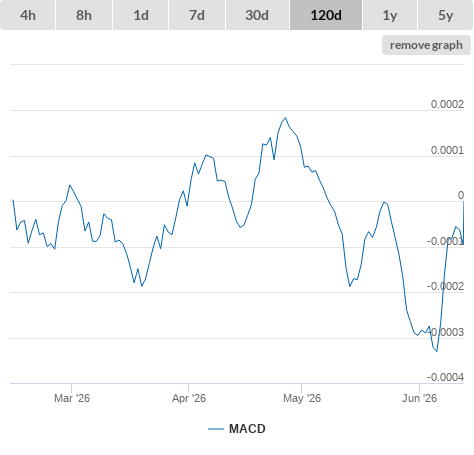
| 12-06-26 | MACD higher than 0 (true) | buy |
|
| Information |
|---|
| Links |
|---|
| General (click metric to see the graph on the left side) | |
|
|
|
|
|
|
|
|
|
|
|
|
|
|
|
|
|
|
|
|
|
|
|
|
|
|
|
| Github (click metric to see the graph on the left side) | |
|
|
|
|
|
|
|
|
|
|
|
|
|
|
|
|
|
|
|
|
|
|
|
|
| Reddit (click metric to see the graph on the left side) | |
|
|
|
|
|
|
|
|
|
|
|
|
| Search results (click metric to see the graph on the left side) | |
|
|
|
|
|
|
| Technical Indicators (moving averages) (click metric to see the graph on the left side) | |
|
|
|
|
|
|
|
|
|
|
|
|
|
|
|
|
|
|
|
|
|
|
|
|
|
|
|
| Technical Indicators (oscillators) (click metric to see the graph on the left side) | |
|
|
|
|
|
|
|
|
|
|
|
|
|
|
|
|
|
|
|
|
|
|
|
|
| Twitter (click metric to see the graph on the left side) | |
|
|
|
|
|
|