| Date | Signal | Status | Proof |
|---|---|---|---|
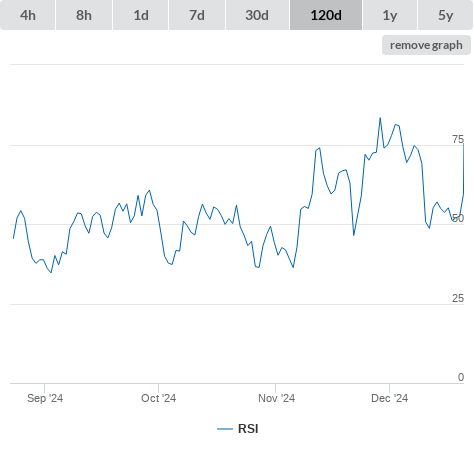
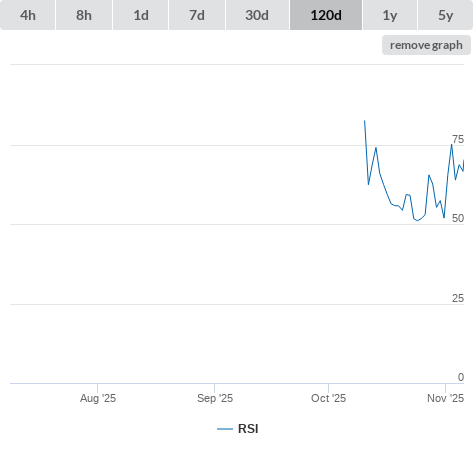
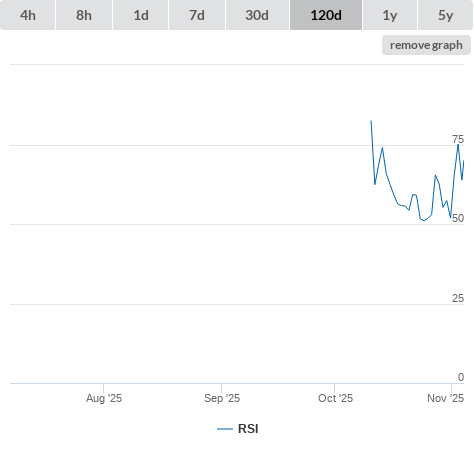
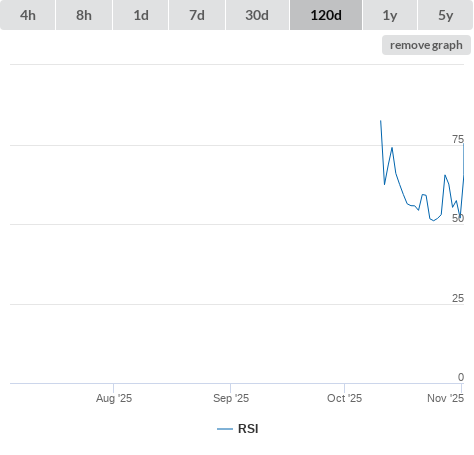
| 05-11-25 | RSI higher than 70 (true) | sell |
|
| 04-11-25 | RSI higher than 70 (true) | sell |
|
| 01-11-25 | RSI higher than 70 (true) | sell |
|
| Information | ||
|---|---|---|
| Description | Horizen is an inclusive ecosystem where everyone is empowered and rewarded for their contributions. Horizen’s massively scalable platform enables businesses and developers to quickly and affordably create their own public or private blockchains on the largest node network in the industry. Horizen’s Sidechain SDK provides all necessary components for easy and fast deployment of a fully customizable blockchain. | |
| Development status | On-going development | |
| Hash algorithm | Equihash | |
| Open source | true | |
| Org structure | Semi-centralized | |
| Proof type | Proof of Work | |
| Started at | 2017-05-30T00:00:00Z | |
| Type | coin | |
| Links | ||
|---|---|---|
| Announcement | https://bitcointalk.org/index.php?topic=2047435 | |
| Blog | https://academy.horizen.global/ | |
| Chat | https://horizen.global/invite/telegram | |
| Discord | https://discord.gg/SuaMBTb | |
| Explorer | https://zen.tokenview.com | |
| https://www.facebook.com/horizenglobal/ | ||
| Message board | https://forum.horizen.global/ | |
| https://www.reddit.com/r/Horizen | ||
| Source code | https://github.com/ZencashOfficial | |
| Telegram | https://t.me/horizencommunity | |
| https://twitter.com/horizenglobal | ||
| Wallet | https://www.horizen.global/wallets/ | |
| Website | https://academy.horizen.global | |
| Whitepaper | https://static.coinpaprika.com/storage/cdn/whitepapers/147.pdf | |
| Youtube | https://youtu.be/3q6IvMRWapc | |
| General (click metric to see the graph on the left side) | |
|
|
|
|
|
|
|
|
|
|
|
|
|
|
|
|
|
|
|
|
|
|
|
|
|
|
|
| Github (click metric to see the graph on the left side) | |
|
|
|
|
|
|
|
|
|
|
|
|
|
|
|
|
|
|
|
|
|
|
|
|
| Reddit (click metric to see the graph on the left side) | |
|
|
|
|
|
|
|
|
|
|
|
|
| Search results (click metric to see the graph on the left side) | |
|
|
|
|
|
|
| Technical Indicators (moving averages) (click metric to see the graph on the left side) | |
|
|
|
|
|
|
|
|
|
|
|
|
|
|
|
|
|
|
|
|
|
|
|
|
|
|
|
| Technical Indicators (oscillators) (click metric to see the graph on the left side) | |
|
|
|
|
|
|
|
|
|
|
|
|
|
|
|
|
|
|
|
|
|
|
|
|
| Twitter (click metric to see the graph on the left side) | |
|
|
|
|
|
|